
Analysis
In metallography, knowledge about the properties of a material play a major role today in research, design, manufacturing and quality assurance.
Image analysis methods are often used to obtain key data.
The microscopically captured micrographs are detected, classified and differentiated, tagged, marked and visualised using the analysis tools of the dhs Image Data Base according to various standards.
Depending on the material and method of preparation, eight software modules are available.
A wide variety of application options can also be found under Applications.
-
Grain Size:
Standard compliant determination of grain size by image analysis.The dhs analysis module grain Size uses greyscale determination to detect the particle grain sizes contained in the structure via the linear intercept method and / or the planimetric procedure. These methods are used for single-phase-ferrite and two-phase-ferrite/perlite structures, and for colour etchings.
To obtain meaningful results, you can analyse several micrographs or subsections of a specimen. The results are collected and shown in a freely configurable results table.
The standards-compliant evaluation is performed as per DIN EN ISO 643, JIS G 0551 (2013) and ASTM-A247. After especially developed algorithms the single structure components in the picture are filtered, manipulated, transformed, segmented, separated and the grain border surfaces are reconstructed.
Client-side settings can be saved in profiles to generate reproducible analyses.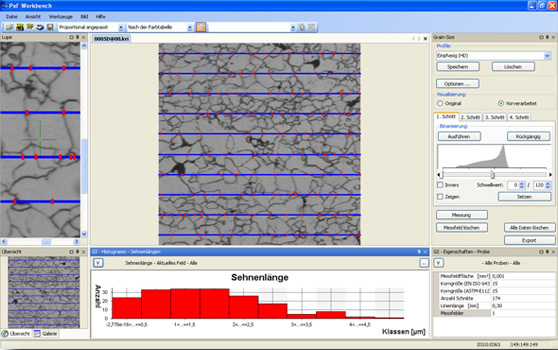
Automatic categorisation and histogram generation (chord length), tabular output of measurements, interactive correction mode (for difficult structures).
Detailed information can be found in our
Data sheet Grain size (PDF: 395 KB) Download -
Phases and Pores:
Detection and analysis of pores, particles and phasesThe dhs analysis module uses greyscale detection to analyse all types of particles and faces in the captured, binarised structure image. Pores, phases, structural constituents, granules and other bulk materials are also ideally suited for automatic phases and pore analysis with dhs Solution.
For image preparation, our software provides tools for image enhancement and options for pre-classification and particle marking.
Further key features are:
- Comprehensive provision of measurements (e.g. area, circumference, min./max. Feret, shape factor, fibre length and thickness)
- Separation and deletion of particles
- Region of interest (ROI) is freely selectable
- Histograms with absolute, relative and cumulative frequency
- MS Excel interface
- Transfer of all resulting images and data to the dhs Image Data Base
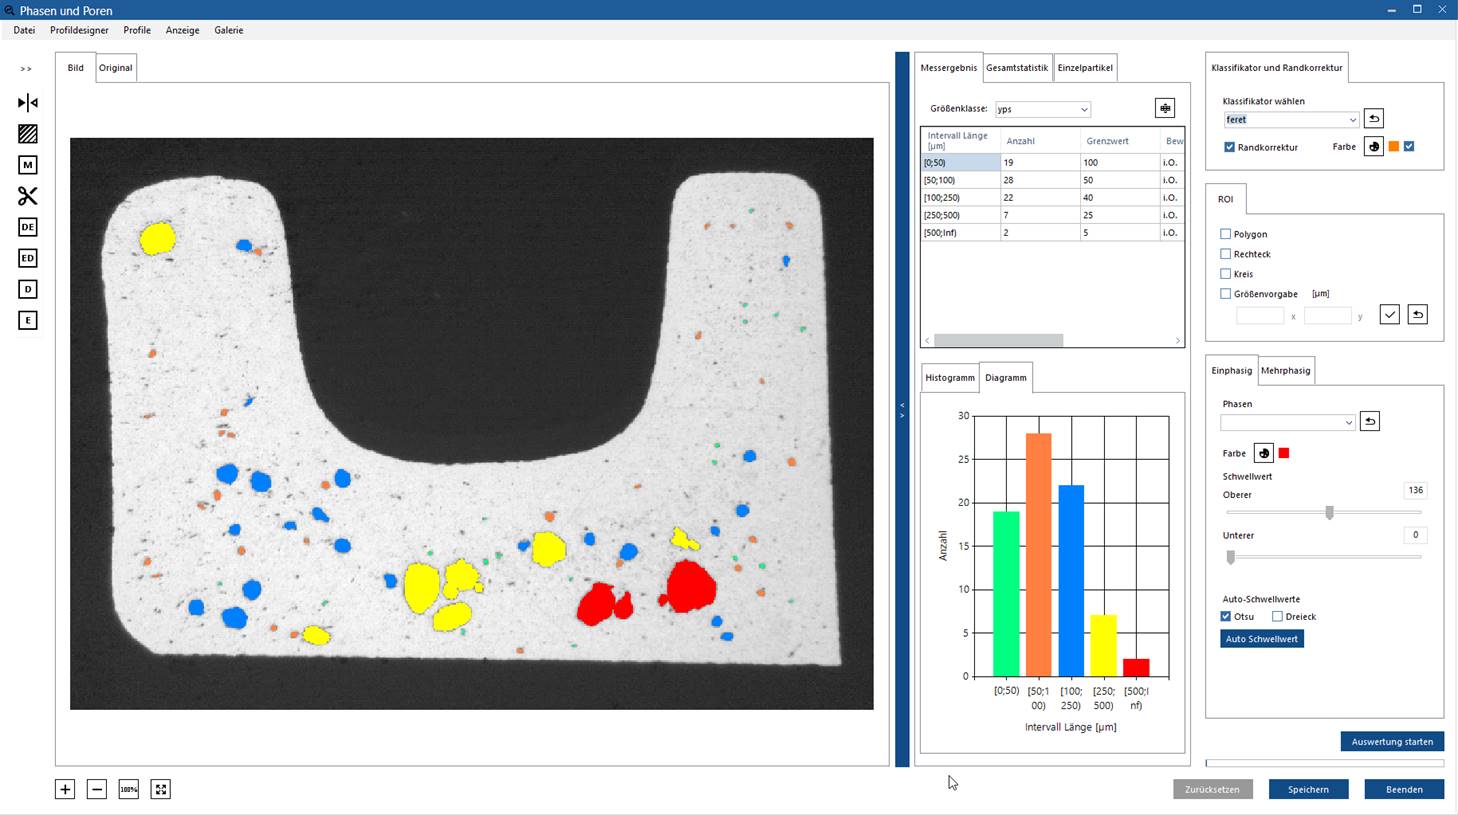
Immediate results display, automatic diagram generation
The module has been developed in such a way that it can also be licensed individually,
depending on the applicationDetailed information can be found in our
Data sheet Phases and pores (PDF: 269 KB) Download Data sheet Phases (PDF: 214 KB) Download Data sheet Pores (PDF: 227 KB) Download -
Cast Iron Analysis:
High-End analysis of microstuctures of cast ironA significant factor for the material properties of cast iron is the determination of the graphite particles it contains. The dhs Cast Iron Analysis uses threshold values to detect the graphite particles contained in the micrograph according to size, shape and arrangement.
The evaluations are divided into ductile cast iron, grey cast iron and ferrite/pearlite evaluations, and are performed in accordance with DIN EN ISO 945 and ASTM-A247.
Additional measurement parameters such as:
- Ferrite/pearlite characterisation of the etched specimen
- Graphite proportion
- Determination of the nodularity characteristic
- Quantity and density of graphite particles (absolute and per unit area)
are integrated as standard into the software.
The enhanced software version “Cast Iron Analysis Advanced” also offers the option of:
- Determining the flake size distribution
- Trainable arrangement classifiers for flake graphite.
Image series and their basic settings (calibrations, threshold values) can be saved in profiles in the dhs Image Data Base. They can thus be reproduced at any time and are available for communication or reporting.
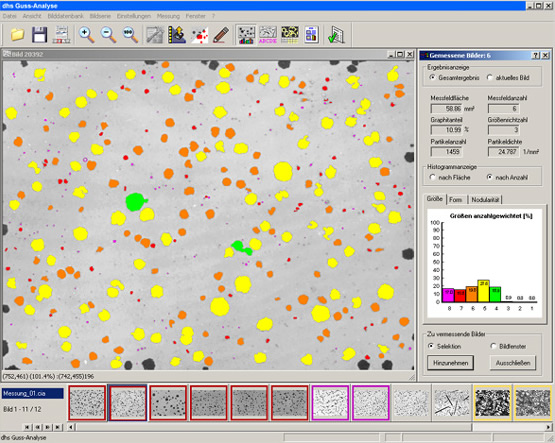
Example for evaluating the proportionate graphite amount as a percentage
Detailed information can be found in our
Data sheet Cast Iron Analysis (PDF: 671 KB) Download -
Layer:
Time-saving and automatic measuring of layers.The dhs Image Analysis module for automatic evaluation and dimensioning of layers in previously captured images of the cross-section of a sample.
During 2D measurement it is possible to automatically evaluate up to 8 different layers. Threshold values are used to detect individual layers, with the brightness value of each pixel serving as the basis – a manual readjustment can be made if necessary. For exceptionally difficult contrast ratios in the image, there is the option of manually outlining with the mouse. The measurement of all layers that do not follow a straight line but are in some way are curved, has also been integrated.
The automatically determined results are displayed in a table:- Smallest/largest measurement
- Mean value
- Standard deviation
and, if desired, they can be stored in the dhs Image Data Base or further processed directly via reporting.
The analysis parameters can be freely selected, such as:- Number of measurement lines in an image
- Spacing of the measurement lines
- Measurements not vertically but in a free angle
- Measurement series of a sample
By being saved in profiles, all the settings and options can be reproduced at any time.
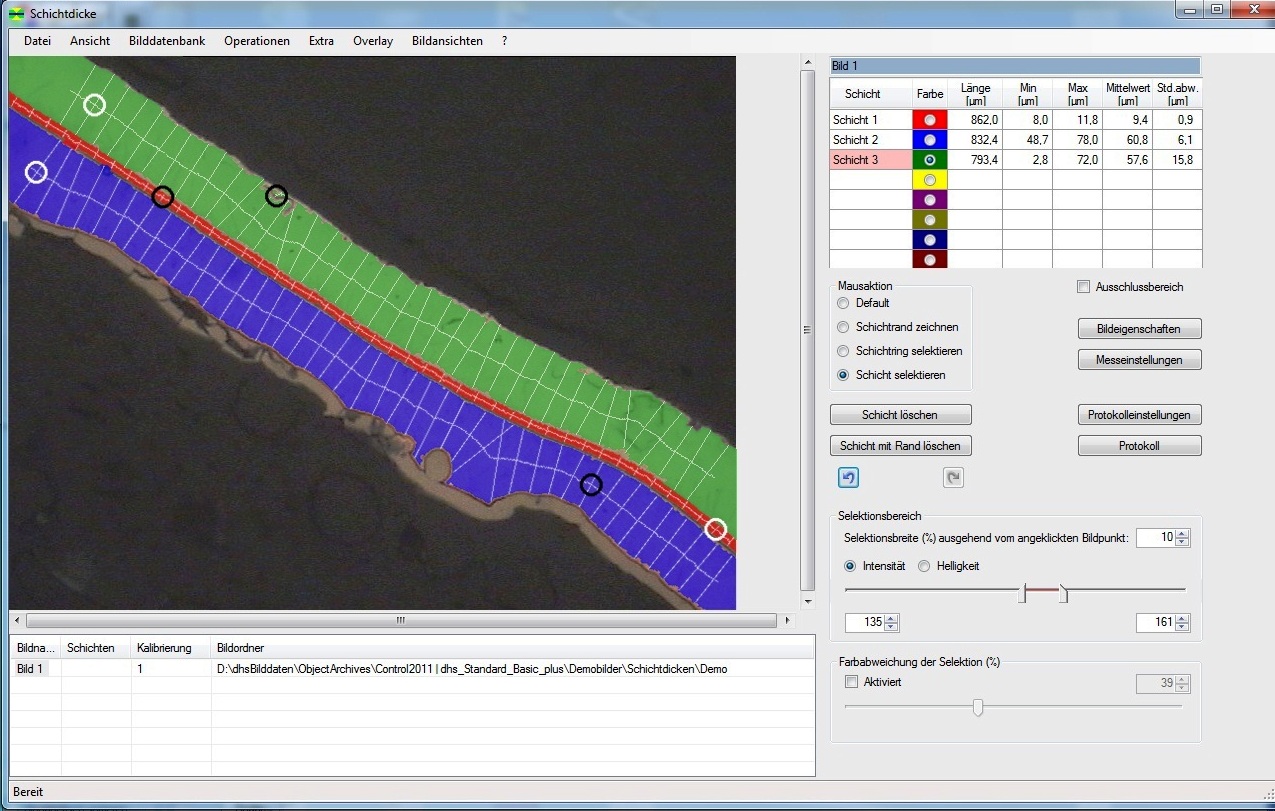
Simply name the individual layers as you choose, then detect all layers by clicking on them with the mouse.
Detailed information can be found in our
Data sheet Layer (PDF: 347 KB) Download -
Steel Inclusions:
For Determination of steel purity – standard-compliant.The analytical properties of steel materials have increased with the introduction of the standard DIN EN 10247 (testing non-metallic inclusions in steels).
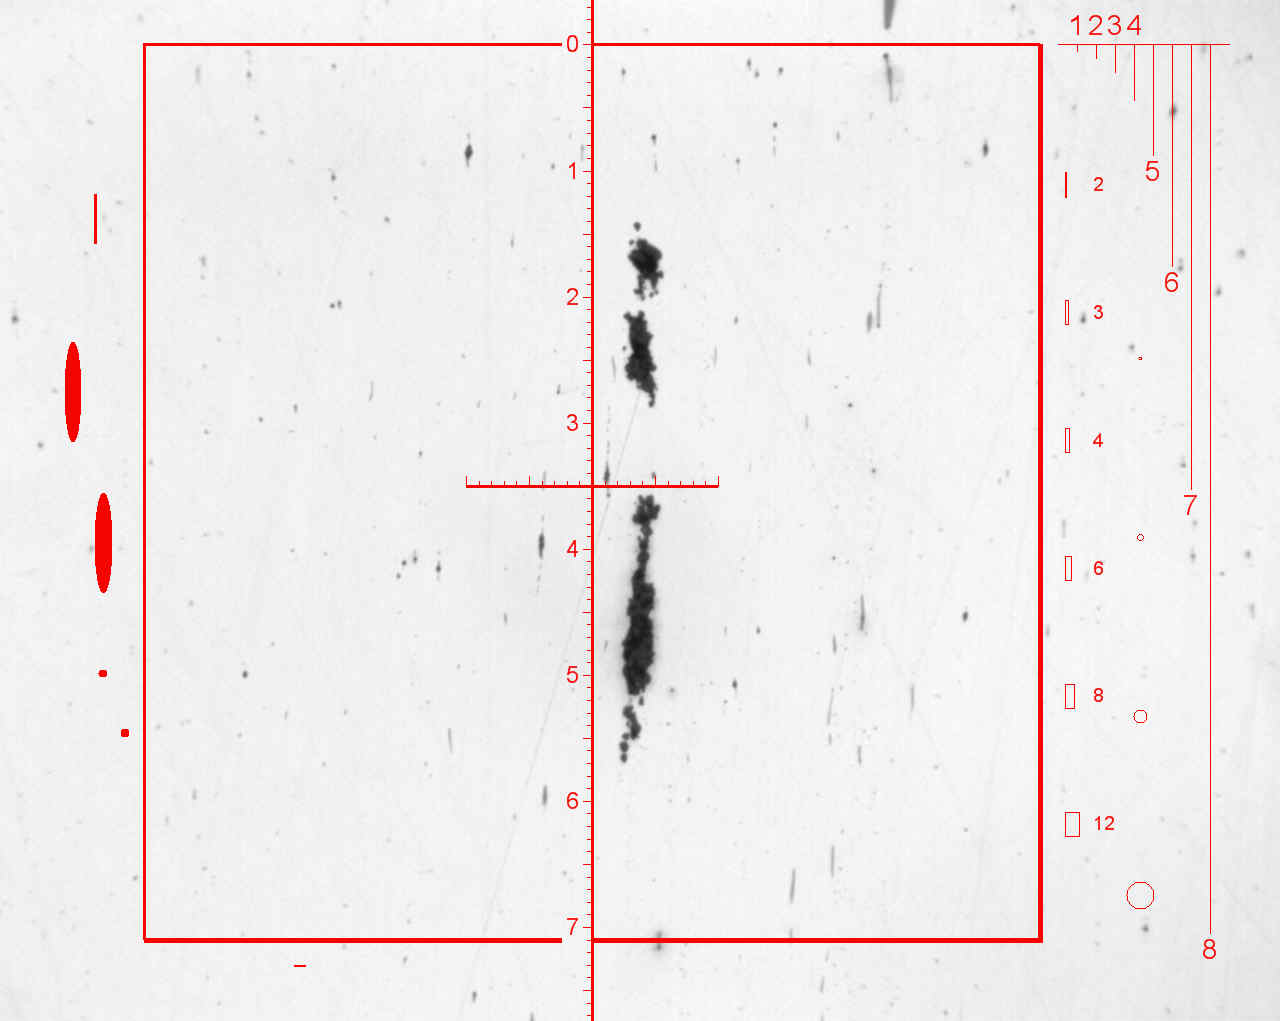
dhs Solution offers a fully automated analysis system for this, which is used to detect, analyse and classify the sulfide and oxide inclusions of the cross-sections. The analysis software determines the geometric parameters, such as size, shape, arrangement and colour.
The complete system consists of a motorised microscope which, by means of adapted Märzhäuser components, enables the high-precision actuation of the table (X/Y) as well as autofocus (Z); ZEISS microscopes, Leica and Meiji microscopes are also available on request. For image transfer, we offer our dhs-MicroCam® – all images and data are archived in the dhs Image Data Base and are ready for communication or reporting.
Other standards such as DIN EN 50602, ISO 4967, ASTM-45, JIS G0555 and NF A 04-106 are supported and the results are presented to comply with the desired standard.
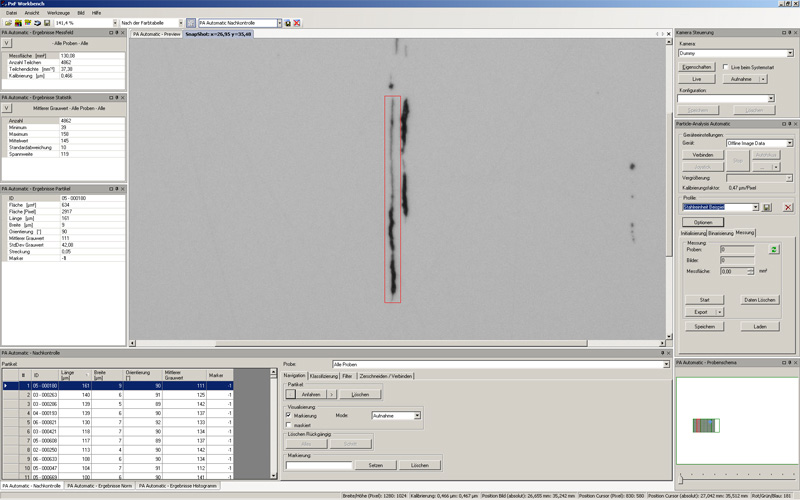
Automatic testing of the complete micrograph section with all inclusions. The only limitation on the number of samples and the size of the measurement areas is the power of the hardware being used. Advantages: speed, reproducibility and ease of use.
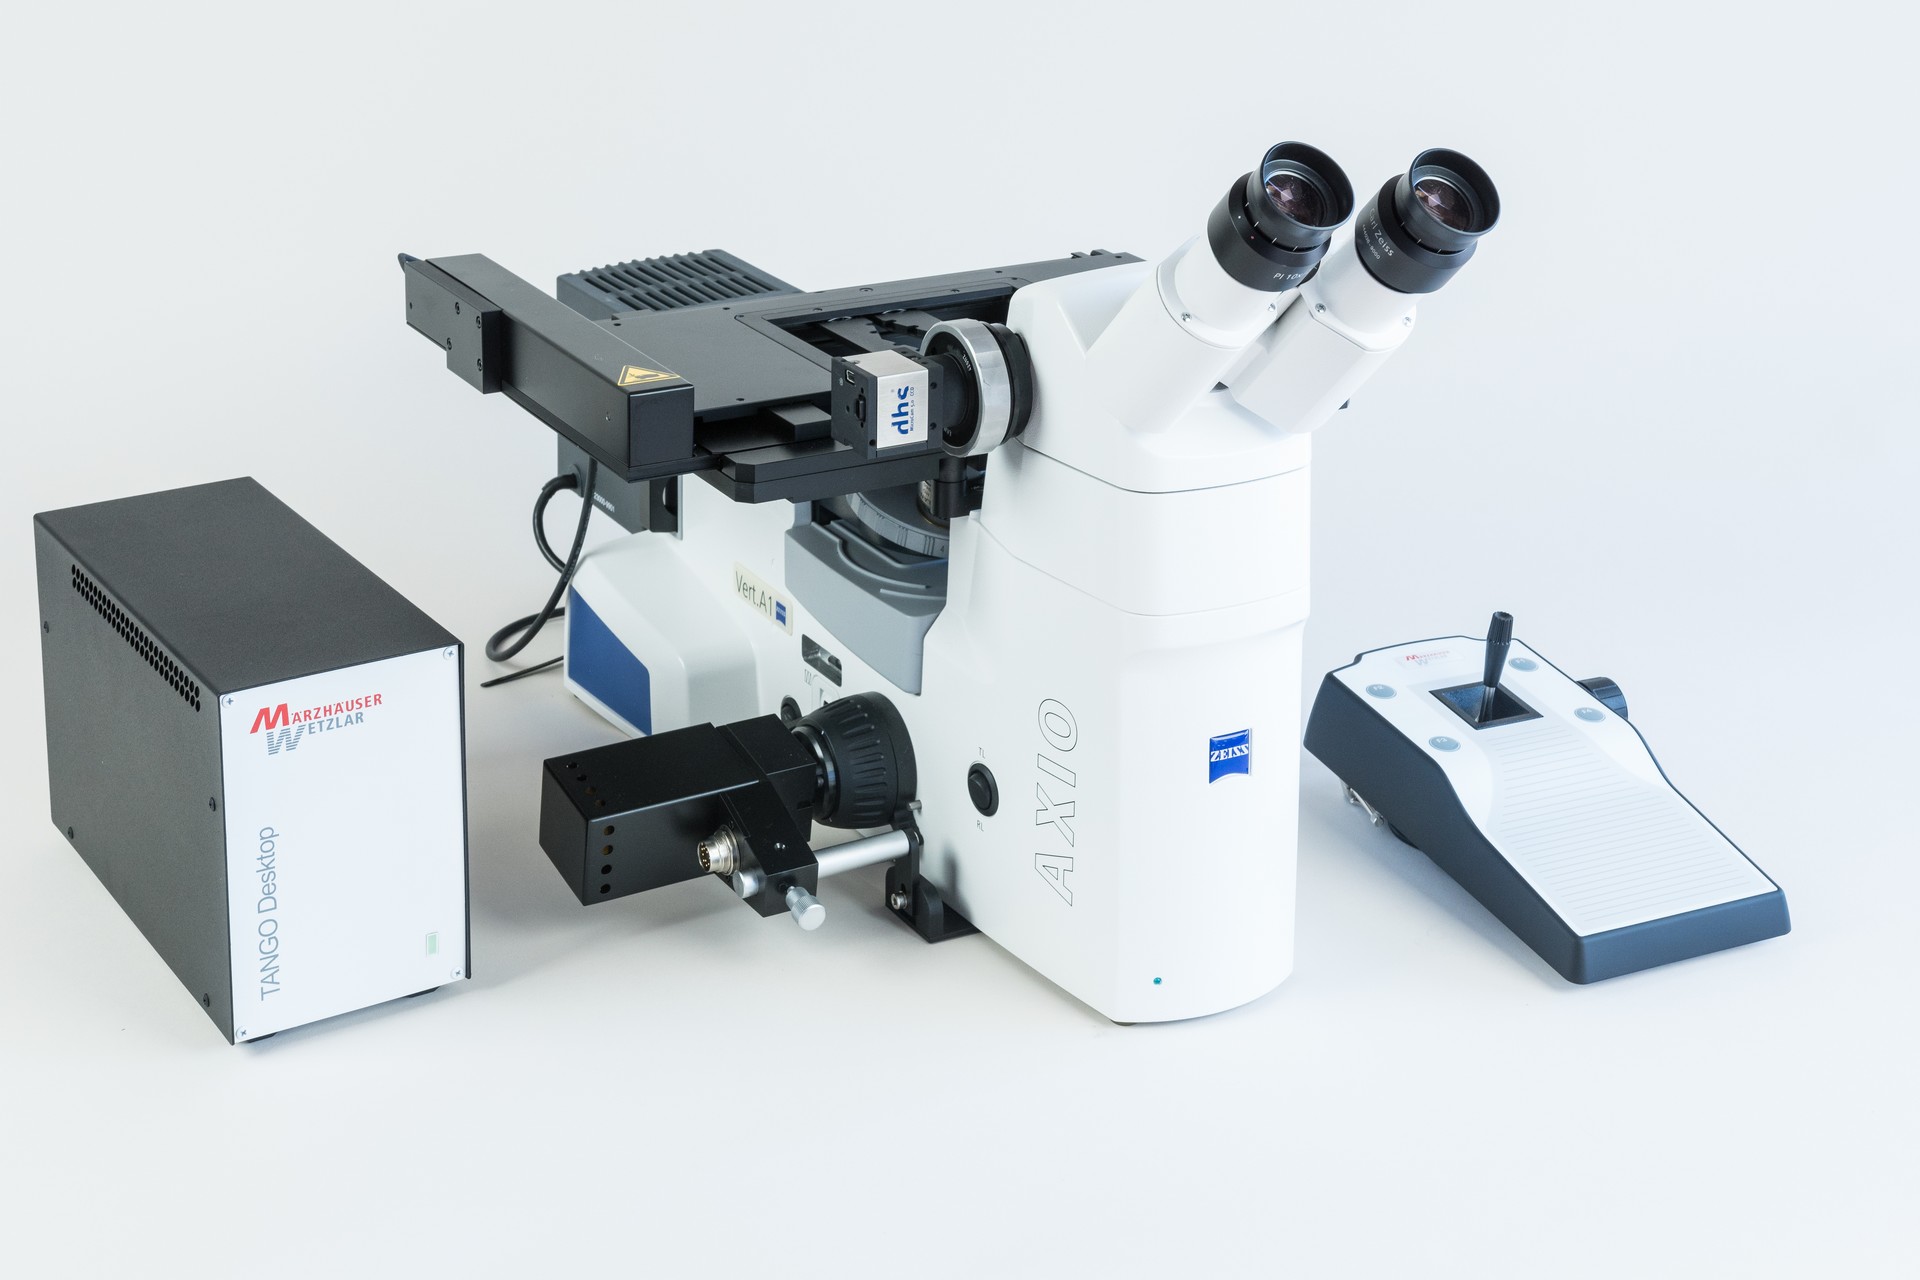
Our example-system consists of microscope, dhs-MicroCam digital camera, thedhs Image Data Base and the dhs analysis software moduls.
Manual method:
Micrograph sections are visually assessed with the existing microscope. The largest inclusion or the worst measuring field are decisive for this. All images (usually less than 20) are transferred to the dhs software and the differentiated evaluation is then triggered using a single command. Here, the virtual eyepiece insert is used as a virtual aid. The manual method is used for tests based on the mean value (e.g. DIN 50602, method K).Depending on the evaluation method or sample volume, we offer fully-automated or semi-automated solutions – but also software support for manual solutions: completely independent of a specific interface.
Naturally, this system can also be used for other image analysis / metallographic tasks, such as Grain Size, Cast Iron Analysis, Particle Analysis, pore evaluation (e.g. according to VW PV6097 and 50097).
Detailed information can be found in our data sheets
Steel inclusions (PDF: 265 KB) Download References steel inclusions (PDF: 281 KB) Download -
Dentride Arm Spacing:
Determination of the mean DAS for aluminium cast alloysThe quality of the material for aluminium cast alloys depends largely on the solidification process of the molten metal – this produces dendrites and branching (arms).
The dhs analysis module Dendrite Arm Spacing determines the average dendrite arm spacing – the measurements are taken as per BDG Directive P220. Parameters for the measurement are the dendrite arm spacing and solidification time. Measurement series and individual measurements are possible.
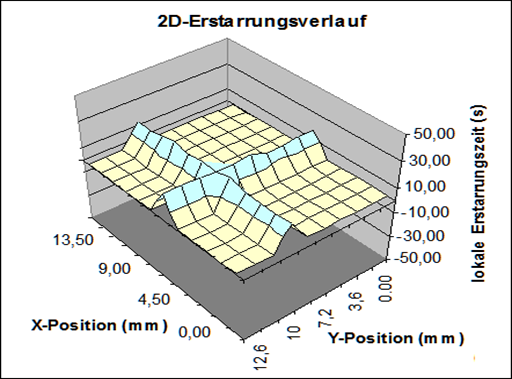
2D-diagram of the solidification time of the grinding sample
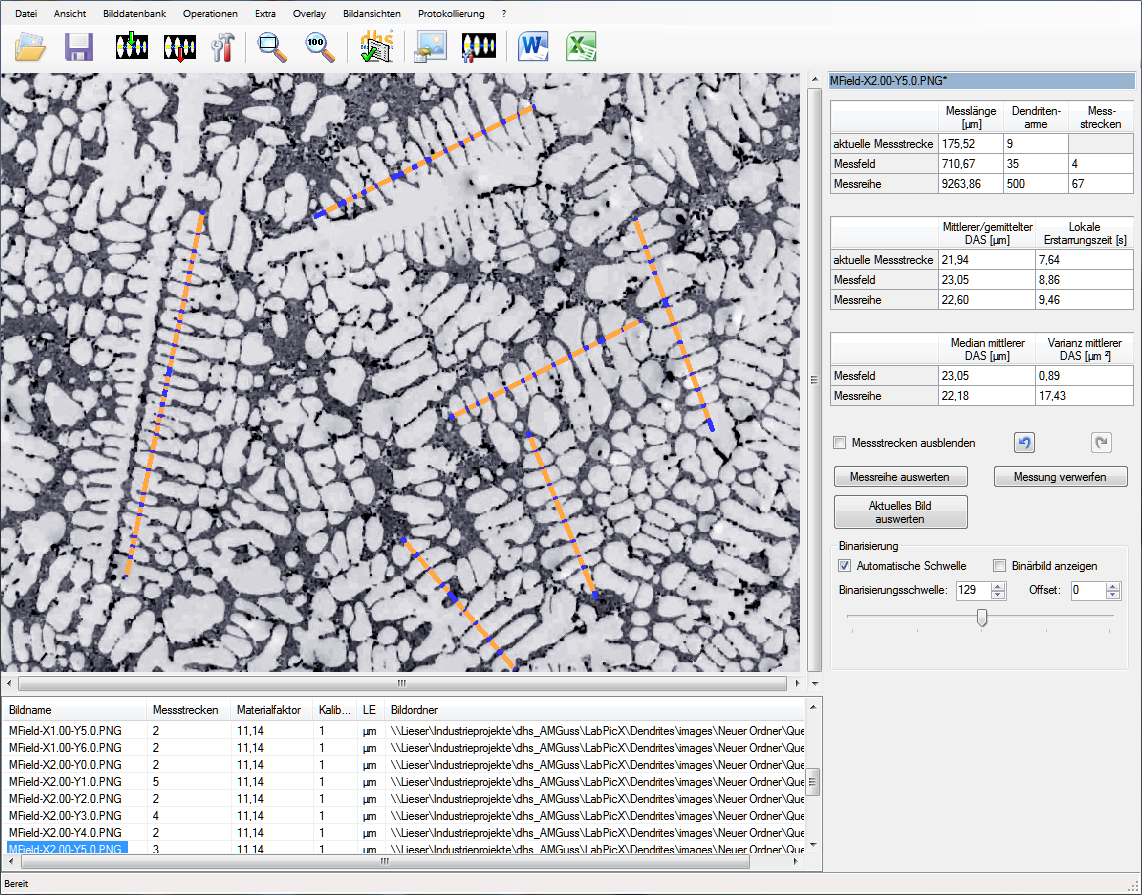
The measurement is carried out directly on the micrograph and the following parameters are displayed in a measurement in tabular form: measurement section, number and length of the dendrite arms, the mean DAS and local solidification time.
All measurements can be stored in profiles and are reproducible.
A measurement transfer to the dhs Image Data Base then takes place, and an MS Excel or Word report (including a accumulation of several samples and associated images) is generated. There is a communication interface to other media.
Connection to all fully-automatic microscopes is ensured.
Detailed information can be found in theData sheet Dendrite Arm Spacing (PDF: 1,3 MB) Download -
Calotte:
Automatic layer thickness measurement with calotte grindingThe dhs analysis module Calotte analyses micrographs, which have to be created by the calotte grinding method. These are often samples that may not be dissected or cut diagonally (e.g. thin layers).
The projected area, which in this procedure is the penetrated coating (calotte), is now evaluated with the dhs software tool Calotte according to the standard EN 1071-2:2002, Part 2 and the coating thicknesses ascertained. The calculation parameters are the grinding node diameter and the inner and outer ring diameters of the respective layer edges.
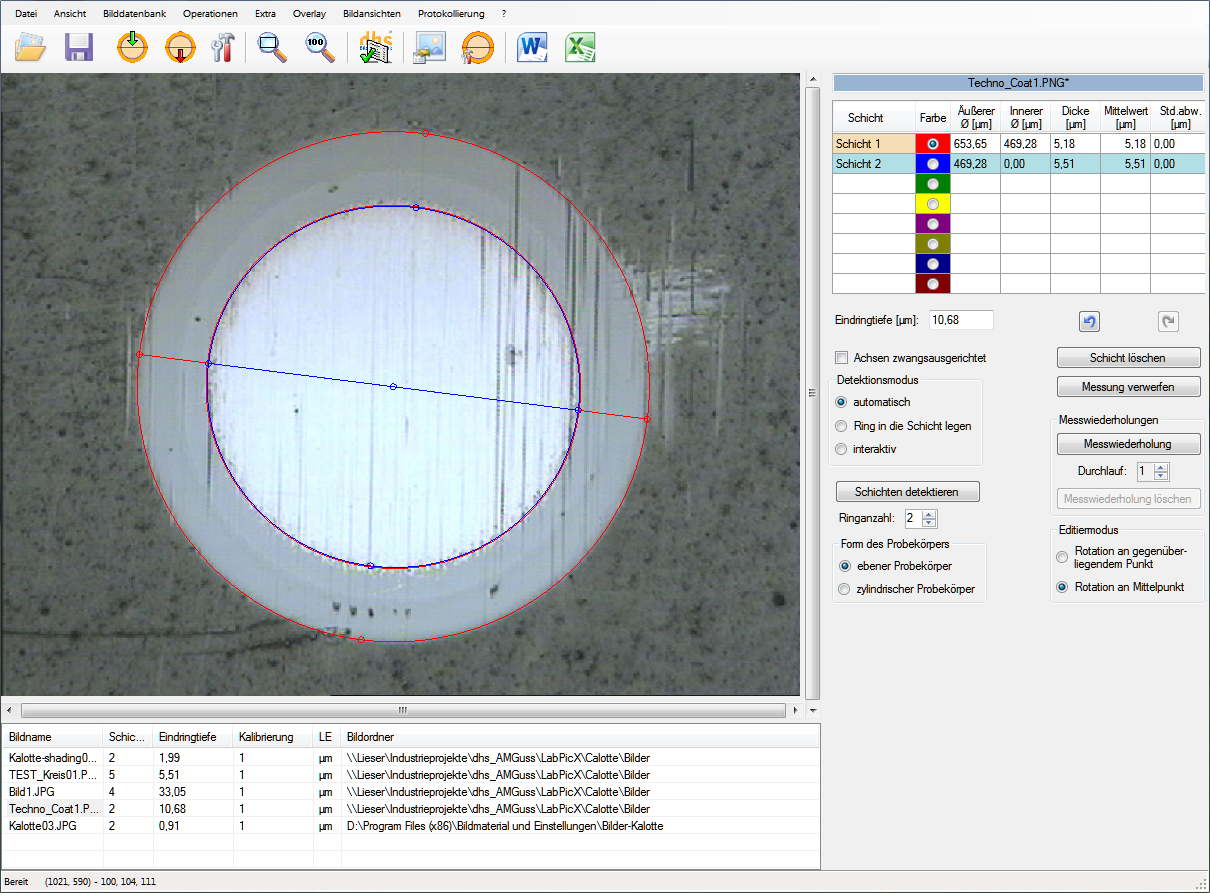
The following parameters are determined:
- Coating thickness and number of all recorded ring structures
- Penetration depth into the substrate / total penetration depth into the sample
- Number of measurement iterations
- Average coating thickness from all individual measurements
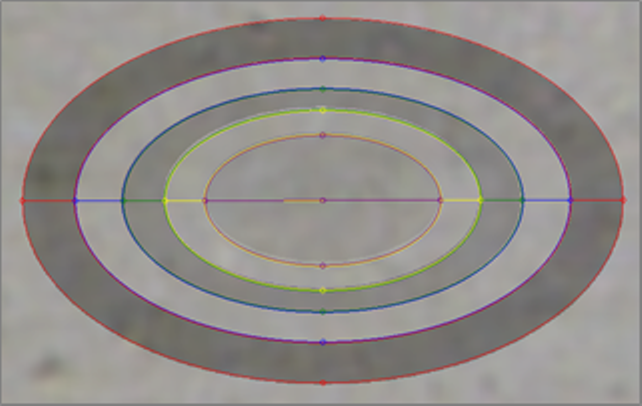
Automatic edge detection of up to 5 points on the layer border; manual processing is also possible here. The identity and colour information of the image are processed during the measurement.
All the images and measurement results are transferred to the dhs Image Data Base for archiving and documentation.
Detailed information can be found in our
Data sheet Calotte (PDF: 1,1 MB) Download